3rd Six Weeks Lab Experiments DataEach lab is in a separate sheet on the same Excel document. Remember that you need to include ALL data from the entire lab in your report, not just the section your group experimented on. Additionally, all graphs need error bars. You MUST use Excel to insert custom error bars, Google sheets does not allow you to enter custom bars. Also remember that you are graphing the averages, not every single data point. Come in for help if you have questions, or send me a message.
|
Molecular Genetics Review of Concepts
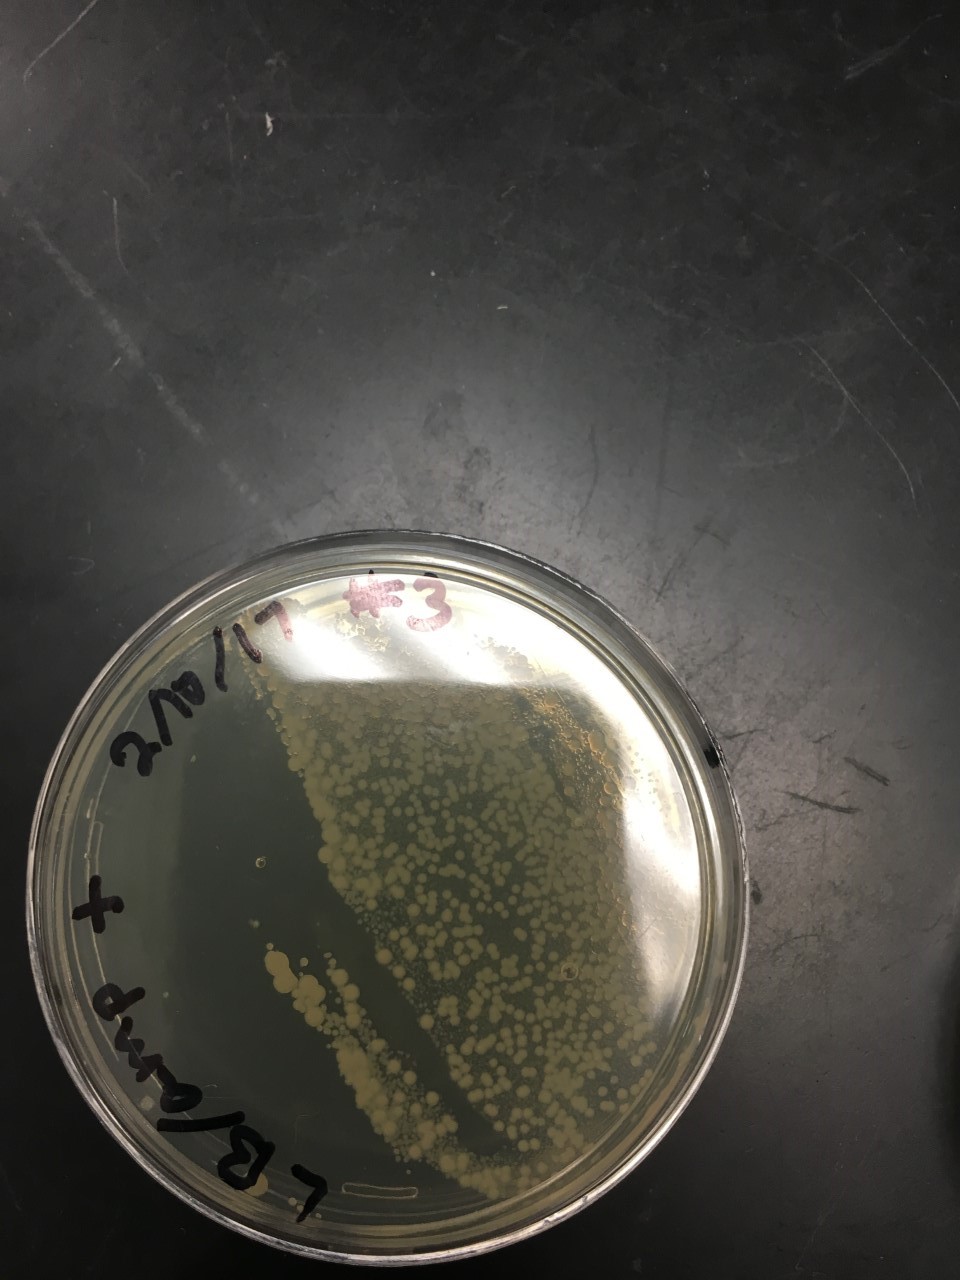
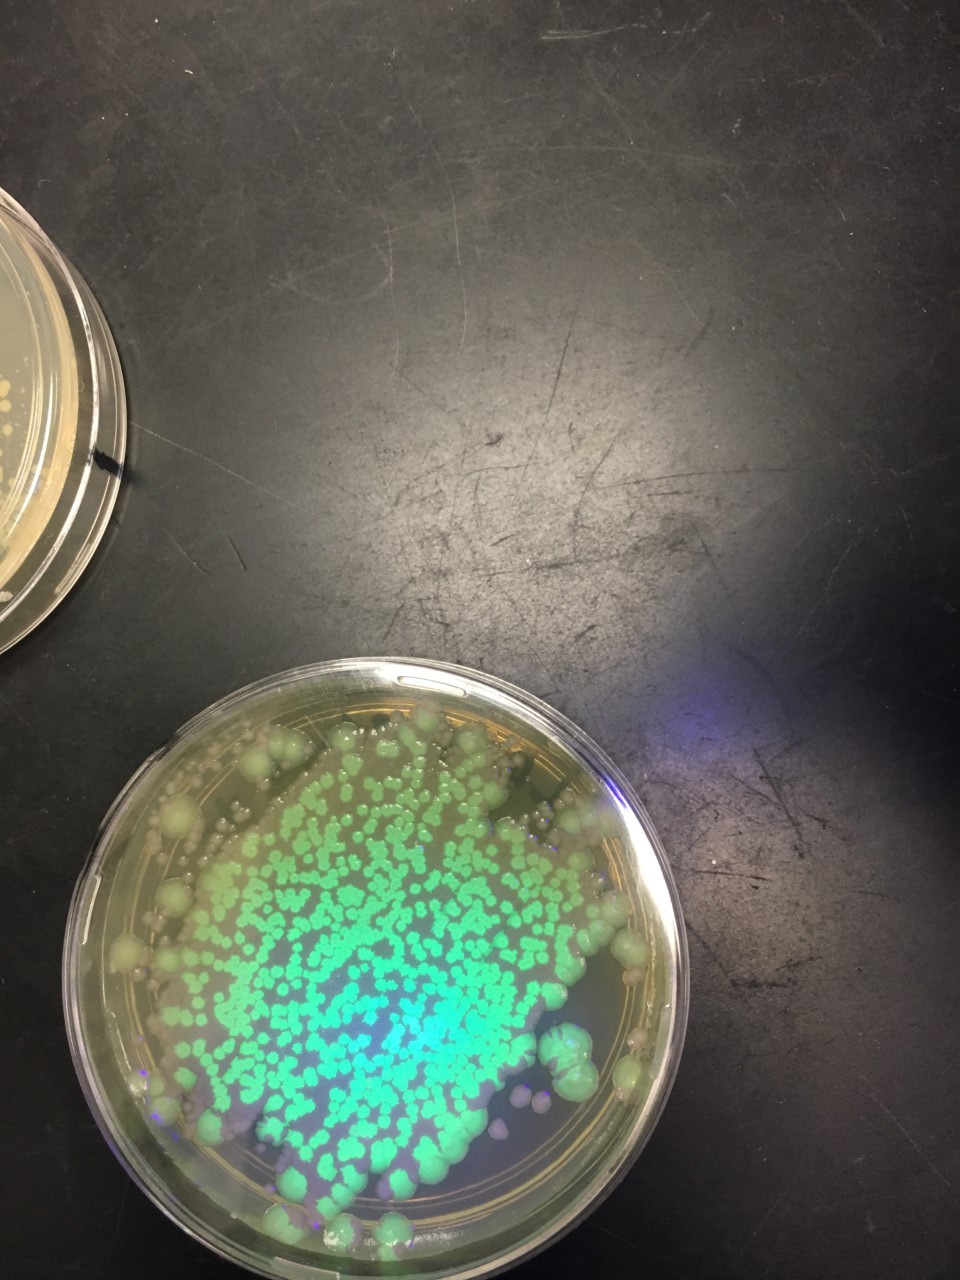
Pictures of pGLO platesIf your group did not get clear enough pictures to measure individual colonies in imageJ, then use the images below.
Analysis of pGLOYou are going to use imageJ to analyze your pictures of your bacterial colonies that contained the pGLO plasmid. Follow the instructions on the document below of how to use imageJ. Complete the pGLO transformation WS for a grade.
| ||||||||||||||||
